- JOpera for Eclipse
- About
- Documentation
- Manual
- JOpera Help
- 1. Introduction
- 2. Getting Started
- 3. Hello World Tutorial
- 4. Web Services Tutorial
- 5. Monitoring Widget Tutorial
- 6. Java Services Tutorial
- 7. Frequently Asked Questions
- 8. How To...
- 9. JOpera Visual Composition Language Reference
- 10. Feature Reference
- 11. Lineage Tracking
- 12. How to write Service Invocation Plugins
- 13. Library Reference
- 14. Component Type Reference
- 15. How to write Documentation
- Publications
- Research
- Screenshots
- Talks
- Videos
- Workflow Patterns
- FAQ
- Manual
- Download JOpera
- Forums
- Search
11. Lineage Tracking
Wed, 10/13/2010 - 10:41 — frisonim
11.1: Versioning
11.1.1: Introduction
The versioning represents an extension to JOpera aiming at a better version management of processes and programs. It enables to qualify a version with a tag, e.g. stable, unstable or deprecated, and provides UI functionalities to duplicate existing entities and increment automatically their version number.
11.1.2: Use
The use of versioning is straightforward. The general information section, as seen in Figure 11.1, provides a line for version management and a few corresponding widgets.
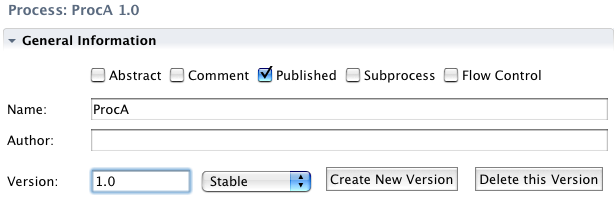
Figure 11.1: The versioning widgets in the general information section
Duplication
A duplication of the current process or program is performed when the Create New Version button is clicked. By doing so, the version
number is automatically incremented.
Deletion
Similarly, the deletion of the current process or program is executed when the Delete this Version button is pressed.
Tagging
The tagging of the entity currently displayed is done by mean of the combo menu, as shown in Figure 11.2.
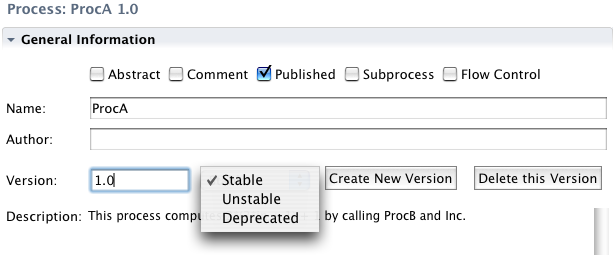
Figure 11.2: Tagging an entity
Outline
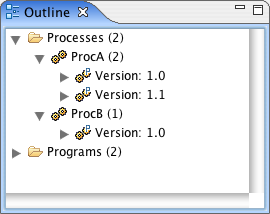
The outline, in JOpera design mode, has been slightly extended to group all same entities with different version numbers together under their common entity name, as seen in Figure 11.3.
11.2: database setup
For the Lineage module to work, in particular the memoization, lineage browser and logger, it is necessary to set up
a PostgreSQL database. The database should be accessible from the host where JOpera runs, in case it is not local. This means
that the right host authorization line should be present in the pg_hba.conf PostgreSQL configuration file, like for instance the
following one:
host all all 192.168.1.0/24 md5Which allows a database access with md5 authentication for a JOpera client that is on the subnet
192.168.1.0/24. Additionally, a user
and password should be set up. The next step is to enter the database connection information in JOpera. This can be done using Eclipse
Jopera's preference page as seen in Figure 11.4.
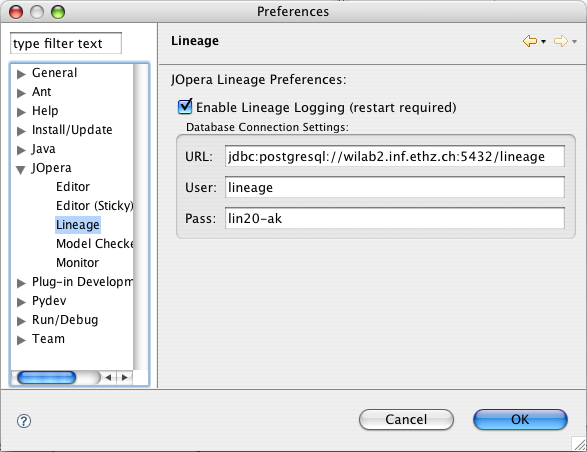
Figure 11.4: Database settings
11.3: Memoization
11.3.1: Introduction
Memoization allows executed instances of programs or processes to get cached in the database. Later on, a reexecution of the same entity with the same input parameters can be restored directly from database without being reexecuted. This is especially interesting for entities that are either fully deterministic or deterministic within a certain time window, and in addition, have a large execution latency.
11.3.2: Use of Memoization
Execution Logging
The use of memoization for JOpera is straightforward and can be done using JOpera UI. The tooling is integrated in the execution section, just underneath the general information section, which are both visible in design mode. A screenshot of the execution settings section is presented in Figure 11.5.
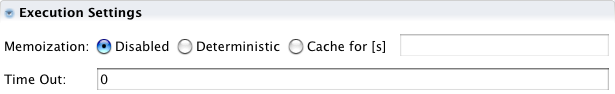
Figure 11.5: Memoization parameters
jopera.ui.lineage plug-in has been installed.
We see in Figure 11.5 the case were memoization has been switched off for the current process by ticking
the Disabled radio box. It is interesting to note that each process or program has got its own memoization settings, so a fine granularity
of which entities have their execution logged to the database for memoization is possible.
Figure 11.6 shows the case, where memoization is turned on. This is done by ticking the Deterministic radio
button on the panel.
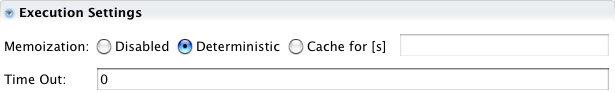
Figure 11.6: Memoization turned on
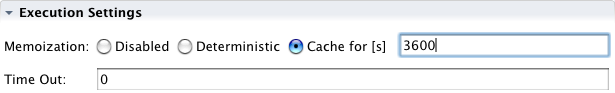
Figure 11.7: Caching with a one hour lifetime
Used of Cached Data
The last step is to use the cached data from the database during process execution. This is a setting that appears in the
launcher panel. In the second tab, Start Options, the radio button Use Cached Execution Data if Available needs to be ticked. This can
be seen in the Figure 11.8.
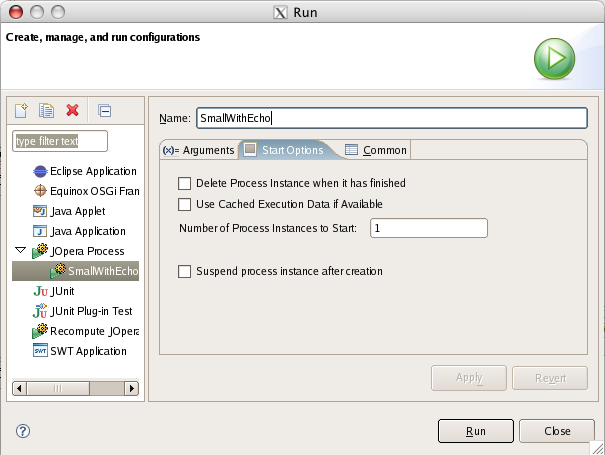
Figure 11.8: Memoization launch configuration
11.4: Lineage Tracking
11.4.1: Introduction
The goal of lineage tracking is, on the one hand, to perform logging of lineage data during process execution, and on the other hand, to allow a confortable browsing of this data, accumulated in the database. The former is performed automatically during process execution and the latter is done using four main components.
- The lineage summary: this view shows the entities logged in the database. It shows various of their attributes and enables to choose one of them and go to the instance browser.
- The instance browser: this view shows a list of instances from an entity along with a certain number of relevant parameters. it is possible to choose an instance and view it in the next component, the lineage browser.
- The lineage browser: this is a graphical component that enables to view graphically programs and processes as well as their relation with respect to lineage tracking. It is possible to browse their hierarchy and dependence. When an entity is selected, its complete property set shows up in the property view.
- The property view: visualize the properties of an entity selected in the lineage browser.
11.4.2: Lineage Summary
As mentioned above, this panel is used to visualize the entities, processes and programs, that have been logged to the database. A certain number of attributes like, among others, name, package, version or description can be seen. A screenshot of the lineage summary can be observed in Figure 11.9.
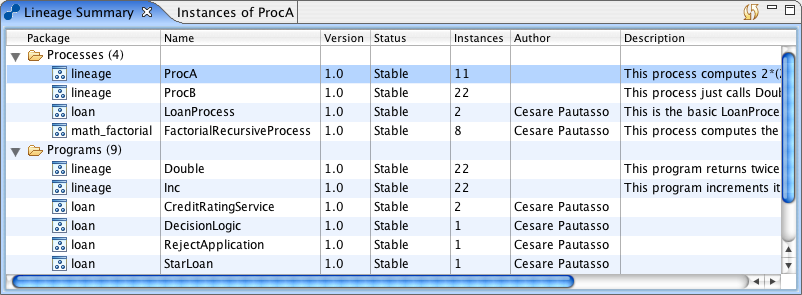
Figure 11.9: The lineage summary
Figure 11.10: The refresh icon
11.4.3: Instance Browser
The instance browser lists the instances of a certain entity logged in the database. In this view, attributes like the input and output parameters along with the execution time and various execution timestamps can be examined. Figure 11.11 shows the instance browser.
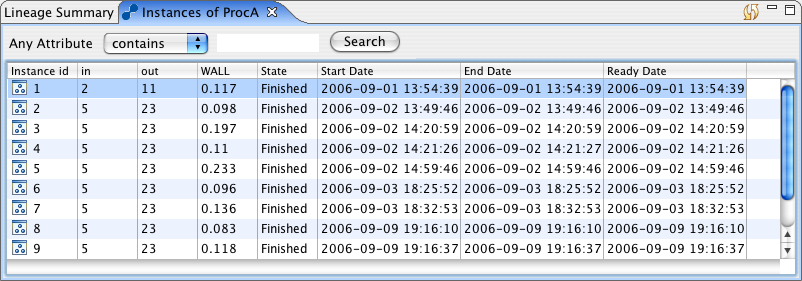
Figure 11.11: The instance browser
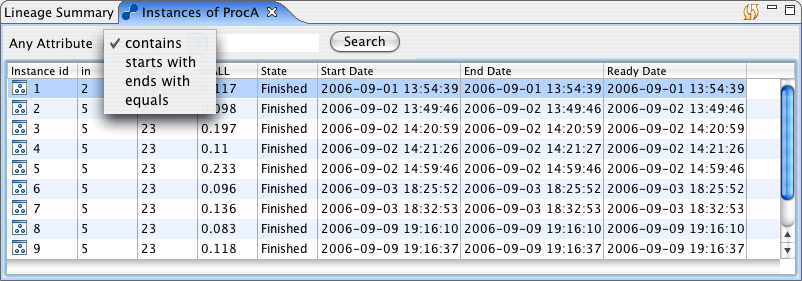
Figure 11.12: The search capability
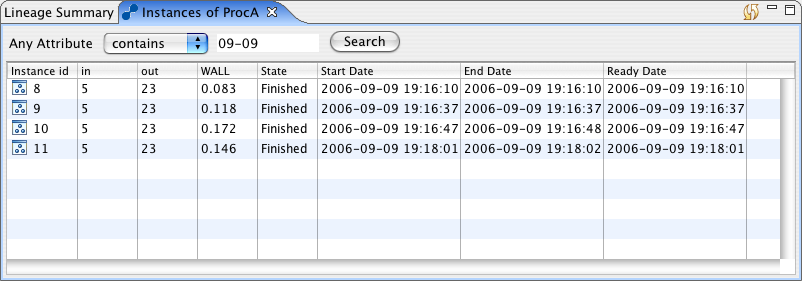
Figure 11.13: The search result
11.4.4: Lineage Browser
The lineage browser is used to browse graphically the entities instances. A starting point could be what is seen in Figure 11.14.

Figure 11.14: A process in the lineage browser
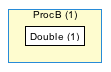
Figure 11.15: A process that has been opened
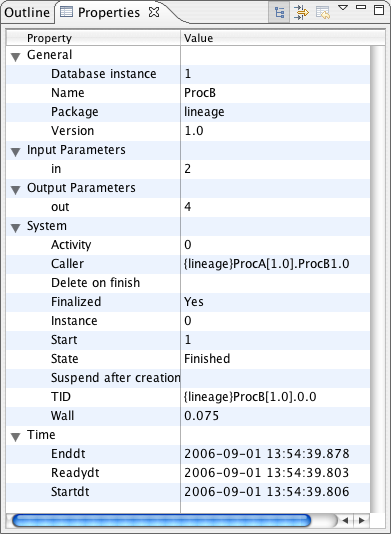
Figure 11.16: Properties of a selected entity
- Get Parent: retrieves hierarchical data from the database and shows the selected entity in its parent context.
- Set New Root: a child entity can be chosen as the new root of the graphical representation
- Expand All: recursive open of the complete subtree rooted by the selected element
- Collapse All: recursive close of the complete subtree
- Expand Process: open the selected process, equivalent to a double-click on it.
- Collapse Process: close the selected process, equivalent to a double-click on it.
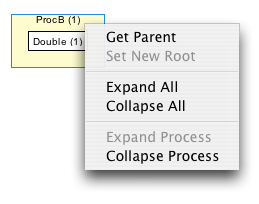
Figure 11.17: Context menu of the lineage browser
Get Parent command in Figure 11.18. ProcB is here represented,
as mentioned, in its parent context of ProcA.
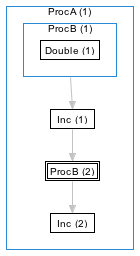
Figure 11.18: The result of Get Parent
11.4.5: Property Panel
The property panel is just a normal property panel, as shown in Figure 11.16. It simply displays the properties of the selected item of the lineage browser.