- JOpera for Eclipse
- About
- Documentation
- Manual
- JOpera Help
- 1. Introduction
- 2. Getting Started
- 3. Hello World Tutorial
- 4. Web Services Tutorial
- 5. Monitoring Widget Tutorial
- 6. Java Services Tutorial
- 7. Frequently Asked Questions
- 8. How To...
- 9. JOpera Visual Composition Language Reference
- 10. Feature Reference
- 11. Lineage Tracking
- 12. How to write Service Invocation Plugins
- 13. Library Reference
- 14. Component Type Reference
- 15. How to write Documentation
- Publications
- Research
- Screenshots
- Talks
- Videos
- Workflow Patterns
- FAQ
- Manual
- Download JOpera
- Forums
- Search
8. How To...
Wed, 10/13/2010 - 10:41 — frisonim
8.1: How to publish a process as a Web service
Actually, you do not have to do anything to publish a process as a Web service: its WSDL interface description is generated by JOpera automatically.
- To look at which processes are currently published, you can point your browser to
http://localhost:8080/wsdl
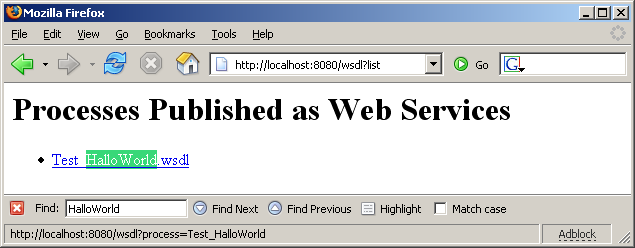
Figure 8.1: The WSDL of the process is generated automatically by JOpera - You can use the WSDL to call the process from your own client and see what happens, as shown in 4.1: Web Services Tutorial Overview. You should compare the overhead of going through the Web service doing so with a normal JOpera subprocess call
Note:
To control whether a process is published as a Web service, use the Published checkbox in the main page of the process editor
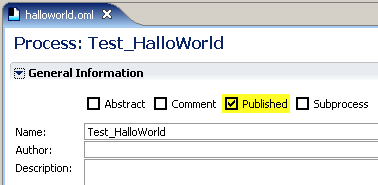
Figure 8.2: Check this box to publish process as Web services
8.2: How to debug a failed task
Debugging a distributed system is a non trivial task, JOpera models abstract some of the complexity of building a distributed application. Still, when things go wrong, tools are provided that help to quickly pinpoint the cause of the problem. This section contains a few tips to help you find out why a process execution has failed.
- Processes fail if any of their tasks fail and no failure handler tasks are provided
- bad input, the information passed in the program input parameters or in the adapter configuration (system input parameters) was incorrect.
- for programs interacting with remote services, a failure may occur due to network connectivity problems. JOpera cannot reach the service provider, or the service provider is offline.
- the service invoked runs, but it fails during its execution. JOpera can detect this, depending on the specific properties of the adapter. For example: UNIX programs will fail if they return a non 0 exit code, Web Service calls will fail upon the return of a SOAP fault message, Java snippet will fail if they raise an Exception.
- compile error, Although the process and its activity may be successfully built and deployed, the Program may have an error and thus is not compiled and deployed. Thus, JOpera cannot find it when it runs the activity referencing it
- system configuration error. Some adapters require the installation of specific JOpera plugins (e.g., the ones for invoking Web services). This means that if the plugin is not installed, the activity will not be able to run.
- the process to be invoked cannot be found
- the process that has been called has failed
How do I find out the cause of the failure and how do I fix it?
Hovering the mouse over a failed task box (displayed in red) will display a tooltip with some error message. Select the task box, this will display the value of all input parameters in the Properties view. Make sure that the parameters contain the values you expect. If a value is missing, check the data flow view and make sure that the parameter is connected. Also in the Properties view, look for the System Input/Output parameters, which vary depending on the adapter used to invoke the service.
- Web services calls will display the request and response SOAP message that was sent. Check if the output message is a fault message
- UNIX or SSH Commands will show the entire content of their stdout/stderr. Also, the exact command line that was run is shown in the System Input parameters. You can copy and paste it into an operating system shell prompt to see if you can reproduce the failure outside of JOpera
- Failed Java Snippets report the uncaught exception in the Exception parameter
8.3: How to display a parameter in a web browser
In JOpera for Eclipse, you can display the value of any process parameter through a web browser, in addition to the various monitoring views JOpera provides from within the Eclipse workbench.
- Starting from within a process monitor, double click on the parameter you would like to display
- This will open up the
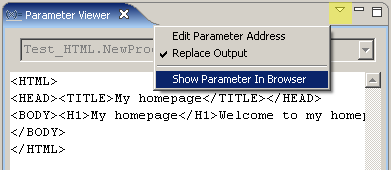
Parameter Viewerview that should already show the content of the parameter - To display it in the browser, open the view drop down menu and select
Show Parameter in Browser - This will open a new browser window (external to Eclipse) that should display the parameter value
Note: Try to do this with a parameter that contains an HTML page!
8.4: How to Report a Bug
The JOpera Developers Team is of course always happy to receive bug reports. Here is how to do it: Use the forums found on http://www.jopera.org to report bugs. Thank you very much for your feedback!