- JOpera for Eclipse
- About
- Documentation
- Manual
- JOpera Help
- 1. Introduction
- 2. Getting Started
- 3. Hello World Tutorial
- 4. Web Services Tutorial
- 5. Monitoring Widget Tutorial
- 6. Java Services Tutorial
- 7. Frequently Asked Questions
- 8. How To...
- 9. JOpera Visual Composition Language Reference
- 10. Feature Reference
- 11. Lineage Tracking
- 12. How to write Service Invocation Plugins
- 13. Library Reference
- 14. Component Type Reference
- 15. How to write Documentation
- Publications
- Research
- Screenshots
- Talks
- Videos
- Workflow Patterns
- FAQ
- Manual
- Download JOpera
- Forums
- Search
4. Web Services Tutorial
Wed, 10/13/2010 - 10:41 — frisonim
4.1: Web Services Tutorial Overview
In order to compose this simple, one-service process in JOpera for Eclipse, the following steps need to be completed:
- A new JOpera Project needs to be created
- The WSDL description of the Web Service needs to be imported
- A new process needs to be defined and input and output parameters need to be added
- A program (resulting from the WSDL import) needs to be added to the process
- The data flow connections need to be drawn
- The process then needs to be compiled (by saving it) and run
- Finally, the execution of the process needs to be monitored
4.2: Creating a new Project
In order to create a new Project, right-click in the JOpera Navigator
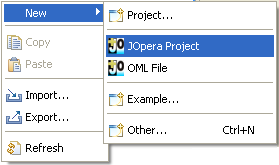
Figure 4.1: Creating a new JOpera project
New > JOpera Project. Choose an appropriate "Project name" ("test" in this case) and click on the "Finish" button.
4.3: Importing a WSDL File
As soon as the new project has been created, right-click on the newly created project. Select "Import..." from the context menu and subsequently choose the "new WSDL Import" from the Import dialog and click on next. On the next dialog
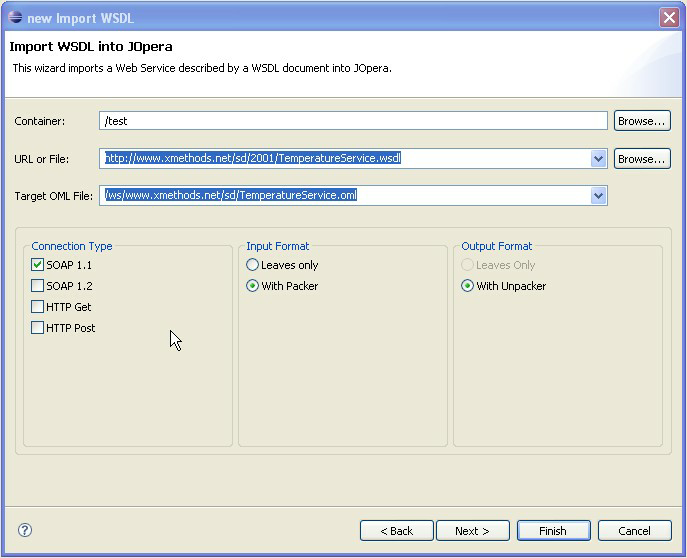
Figure 4.2: Defining the URL of the WSDL file
Note: XMethods has become very unreliable recently. If you have trouble with the above Web service, you may want to look for a similar alternative at: http://webservices.daelab.net/temperatureconversions/TemperatureConversions.wso?WSDL Clicking on "Finish" will finally import the Web Service description.
4.4: Creating a new Process
Double-clicking on the newly created OML file will show all the defined processes and programs in this OML file in the "Editor". Importing the WSDL file creates a new program for each of the Web Services operations. Thus no processes are defined yet.
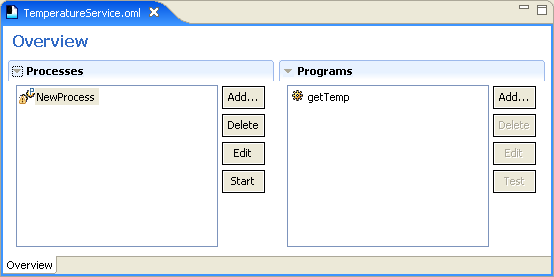
Figure 4.3: Adding a new Process
4.5: Adding Input/Output Parameters
Double-clicking (or clicking on the "Edit" button) on the newly created process will give you are more detailed view, showing the process' parameters, tasks as well as data and control flows. The first thing you may want to do is to change the name of the process (to maybe "getTemperature"). What needs to be done further is adding the input and output parameters. In this simple case only one input and one output parameter is required. Add these by clicking on the "Add..." button right in the "Parameters and Constants" section. Rename them appropriately.
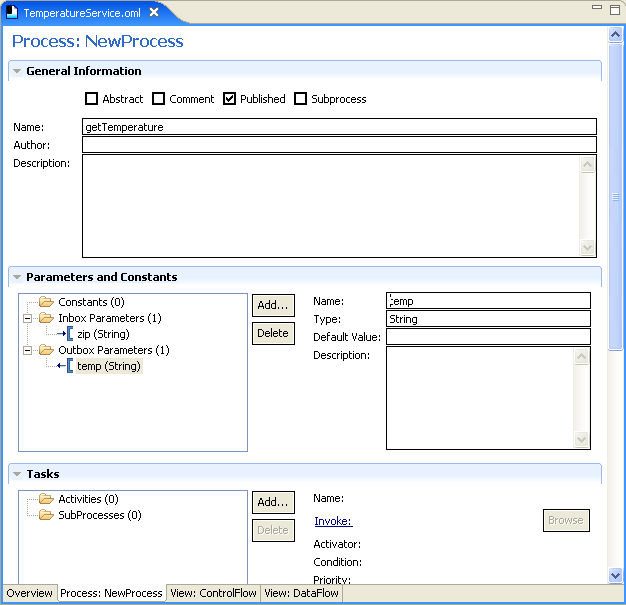
Figure 4.4: Adding Input and Output Parameters
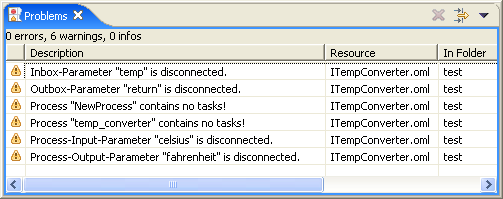
Figure 4.5: Problems reported in the Problems view
4.6: Populating the Process
After having created the process, it's now time to populate it with tasks. In order to do this you can simply drag programs from the "Outline" view and drop them on the data flow of the process you wish to populate.
Note:
If you have switched on versioning support, you will need to open the outline nodes representing the program and drag the node corresponding to its version In the case of this tutorial, the getTemp program is added to the process.
4.7: Draw Data Flow Connections
In order to draw the data flow connections, you first have to switch to the "Data Flow" view of this process. Then the input and output parameters of the process need to be displayed. Displaying the parameters can be done by right-clicking on the process boxes and selecting "Show All Parameters" in the context menu.
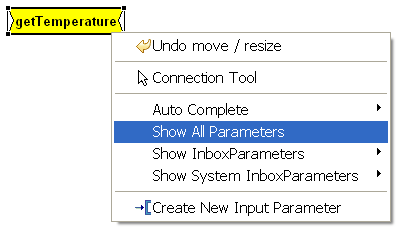
Figure 4.6: Displaying the Parameters of a Process
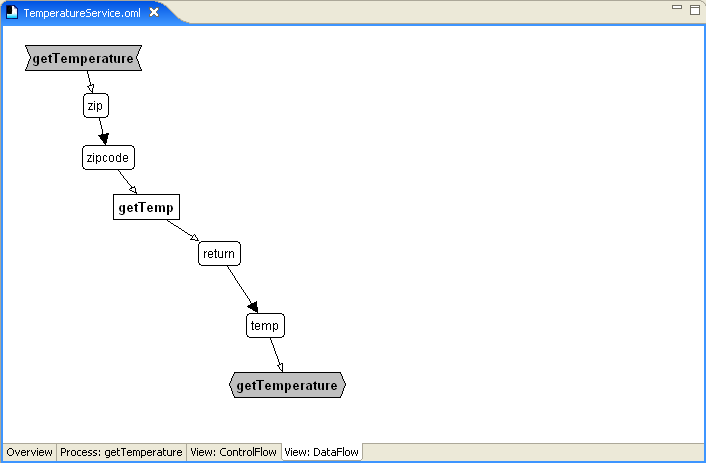
Figure 4.7: Complete Data Flow of the Sample Process
4.8: Compilation of the Process
Compilation of the process is simply done by saving the OML file. Given that there are no problems (check the "Problems" view), the process should be compiled upon saving the corresponding OML file. All you need to make sure is that in the menu "Project", "Build Automatically" is selected. Alternatively you can compile the process by selecting "Build All" in the "Project" menu.
4.9: Executing and Monitoring the Process
In order to run a process, switch to the overview page, select the process name you want to start and then click on the Start button. Make sure that the oml file has been saved. If the process has never been run before an Eclipse launch configuration dialog will be opened and you can use it to specify the process input parameter values. The process will be started as soon as you click on Run.
The next time you start the process, it will be immediately executed. If you want to change the input parameter values, you should use the Run... menu and look for the launch configuration corresponding to your process.
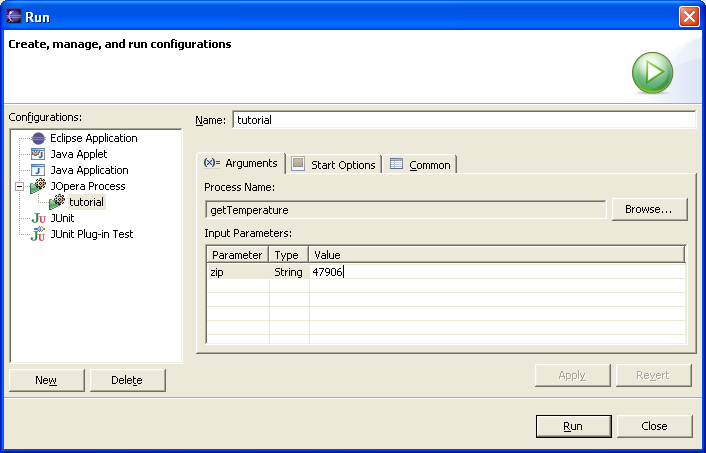
Figure 4.8: Executing the Sample Process
Monitor Mode button. You need to have either the Data Flow or Control Flow opened in order to switch into monitor mode.
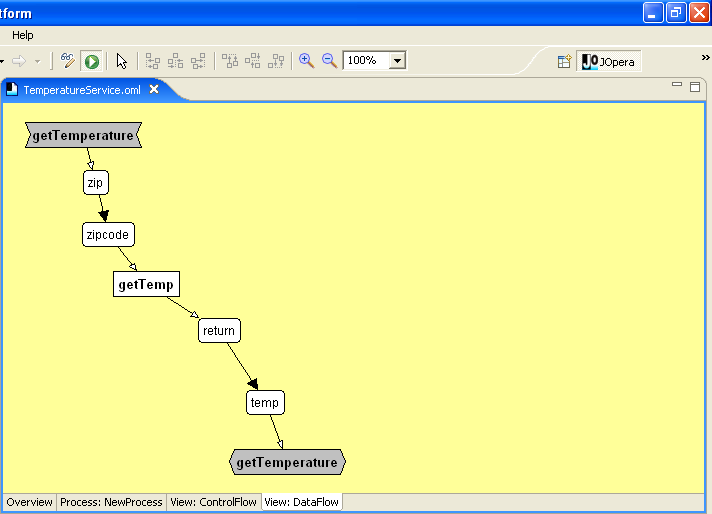
Figure 4.9: Switching to Monitor Mode
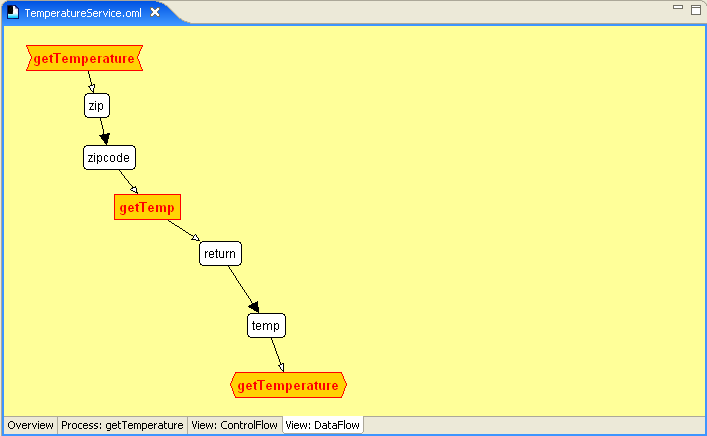
Figure 4.10: Monitoring a Running Process
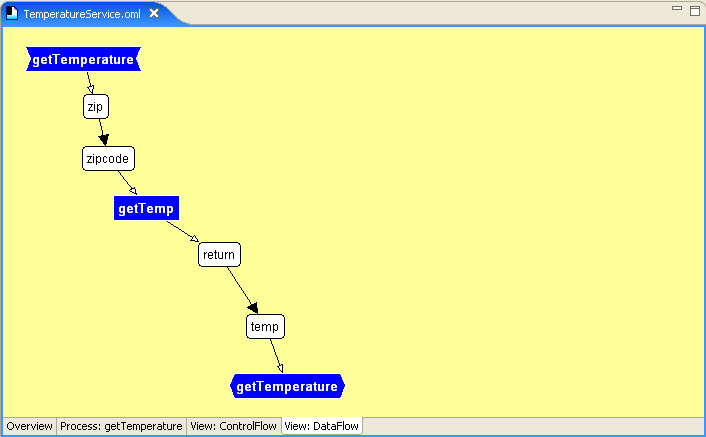
Figure 4.11: Successfully finished Process
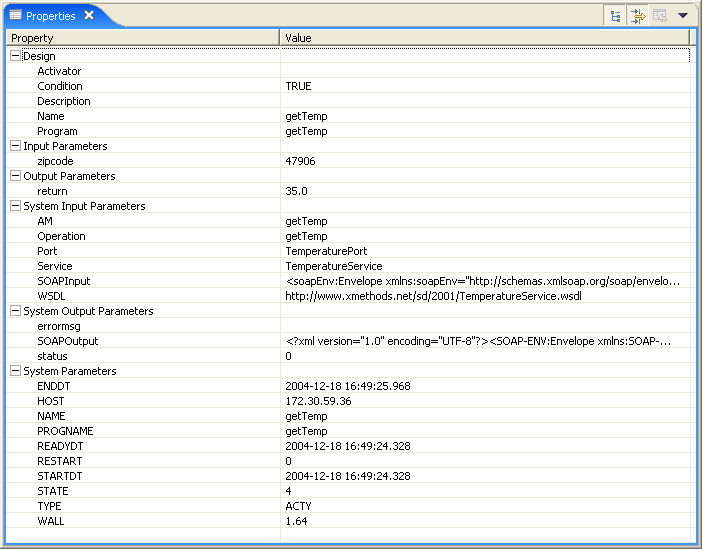
Figure 4.12: Properties of a Finished Task (Tip: to display all of these properties you should press the 'Advanced' button in the view's toolbar)
Kernel Memory Inspector view by selecting it in the Window, Show View menu. The Kernel Memory Inspector shows you all data in the kernel's memory. This includes the input as well as output parameters of the processes and tasks, the state of each process and task and more. The state of each process and task is also highlighted by a the colors blue, red and yellow indicating that a process or task has finished successfully, failed or is still in progress respectively.
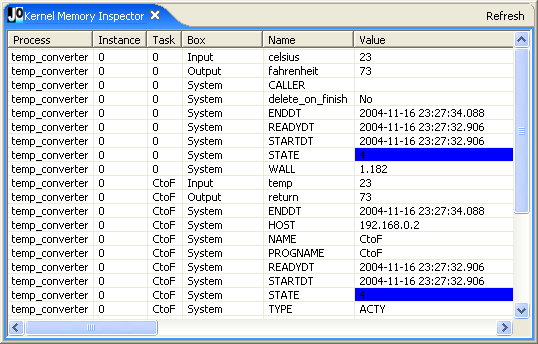
Figure 4.13: Monitoring the Sample Process in the Kernel Memory Inspector